Mobile Scorecards
Tool: Adobe XD
Roles
- UX Designer
- Researcher
- Product Designer
What
Adaptable scorecard redesign.
When
May – August 2023
Where
Pedigree Technologies, Fargo, ND
Intro to Driver Coaching
Overview
Pedigree Technologies has been looking to add the feature of Driver Coaching to the variety of services they provide. Driver coaching can be summed up as a way for drivers to monitor their driving habits and dispute any inaccuracies of their electronic logging devices.
I had an opportunity to research what competitors provided and understand where Pedigree could implement these changes. The stakeholders did not know what this project would entail. It was my task to tease out as many details as I could.
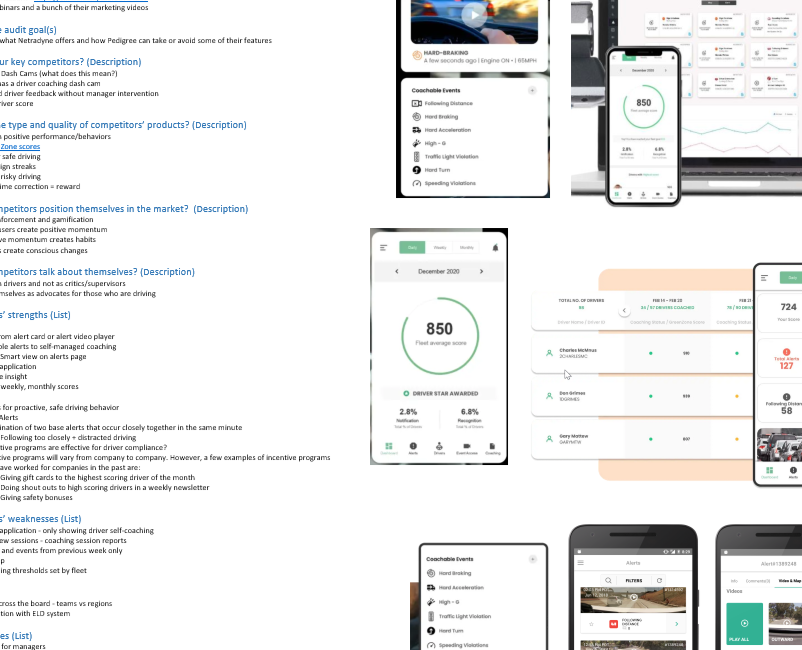
Competitive Analysis
Looking at different companies, many showed Driver Coaching as a separate, standalone application. This approach was straightforward but would be an additional area for the driver to log on to.
Similarities with each company included the following –
A performance indicator in the form of a grade or scorecard
Driver notifications for adverse events
Dashboard landing page
Ability to dispute incorrect data
Start Small and Keep Going
Initially, I was tasked with linking driver coaching functionality through our existing scorecard components. Following our competitors’ approach, I began with dashboard layouts, still using the scorecard capabilities, with added information that drivers may find helpful. Given my previous project was a mobile feature, I included how these dashboards would look in different views, avoiding analysis paralysis just by creating something that I could later flesh out.
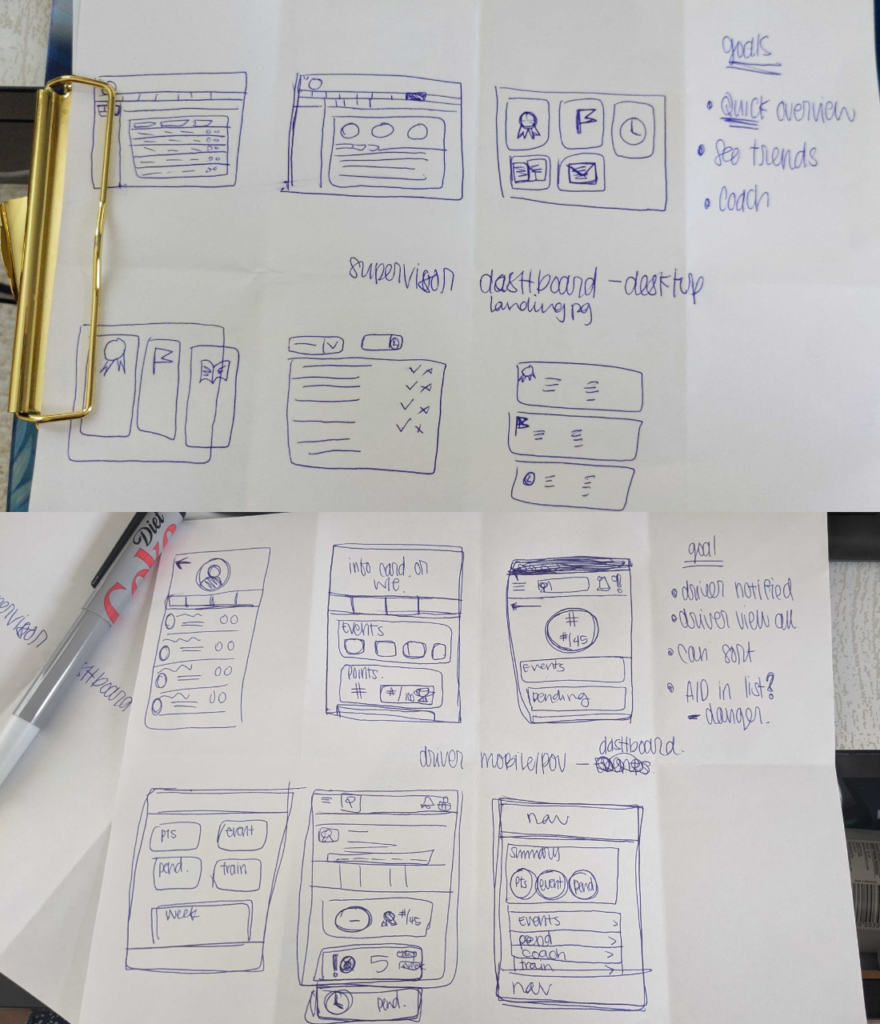
Sketch Sessions
A lot of my initial designs were drawn by hand. This allowed for a quicker turnaround and gave me an idea of how the user journey may flow. With these sessions, I could understand further how this project could be broken down and the most feasible place to start.
Redefining the Goal
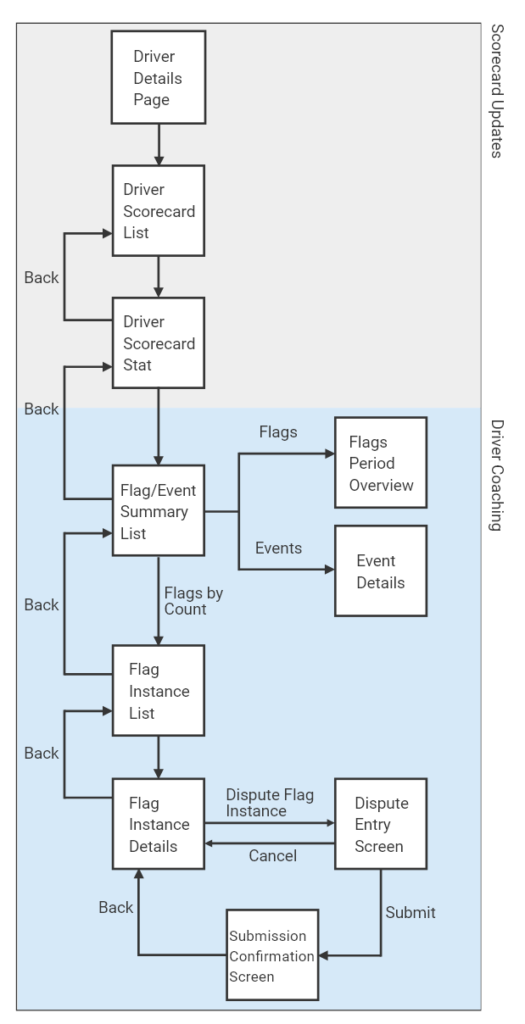
Breaking Up Driver Coaching
After hours of research, sketching, brainstorming, and a barrage of questions, the initial Driver Coaching project was divided into more appropriate user stories. The scorecards were the first components that required the least amount of change but would lay a clean foundation for more considerable feature changes that would follow.
A more focused direction gave me a creative kick to my scorecard designs in desktop and mobile views. Knowing the end goal of Driver Coaching gave me an idea of how these new updates would also need to accommodate more features in the future.
Updated Objective
Redesign the scorecard functionality to be mobile-compatible for users in the field. Design a section that will help easily distinguish users with low scores while maintaining a clutter-free look.
Drivers and managers can see their vehicle and driving statistics through a generalized scorecard. The user can further drill down to specific stats and see where the driver could have improved during a given driving period.
The existing scorecard functionality was built to be viewed on a desktop device. As the company’s services expanded, there became a demand to see the data in a mobile view. This would allow supervisors and drivers alike to check scores on their devices.
Existing Details
I wanted to use small details like the color chip, label formatting, and info card alignment pulled from other sections to create a cohesive look. Because these details have proved helpful in different areas, it allowed less work for both developers and allowed users an easy glance at data.
The initial project prompt was focused on mobile visibility, but these changes were just as valuable for the desktop view. The overall look allowed clients more visibility to their stats.
UI Design
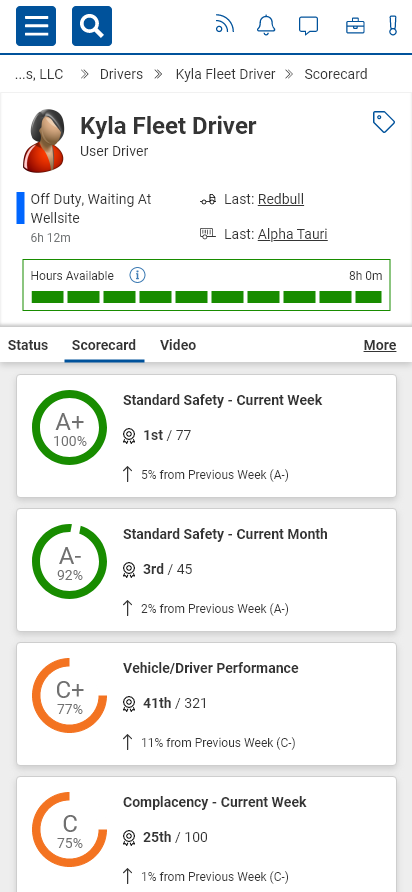
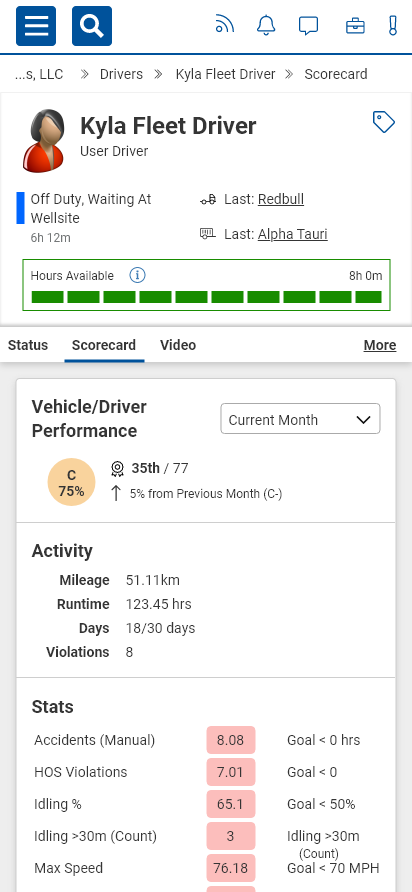
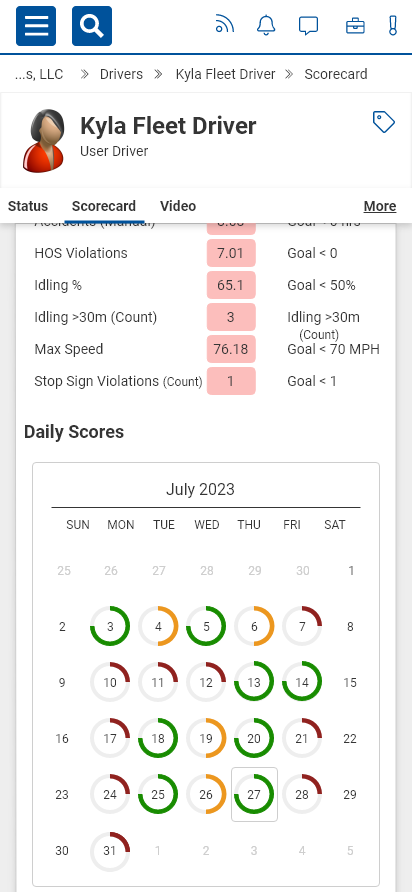
Scorecards can be divided into three sections – overall score, stats breakdown, and stats detail. The overall score culminates the driver’s stats during a given period. The stats breakdown is how many stats or events were accumulated during that period. The stats detail showcases each type of event (Example: Hard Breaking) and the number of times they occurred during a day.
Below is the scorecard summary, the scorecard activity, and the scorecard calendar view.
Future Features
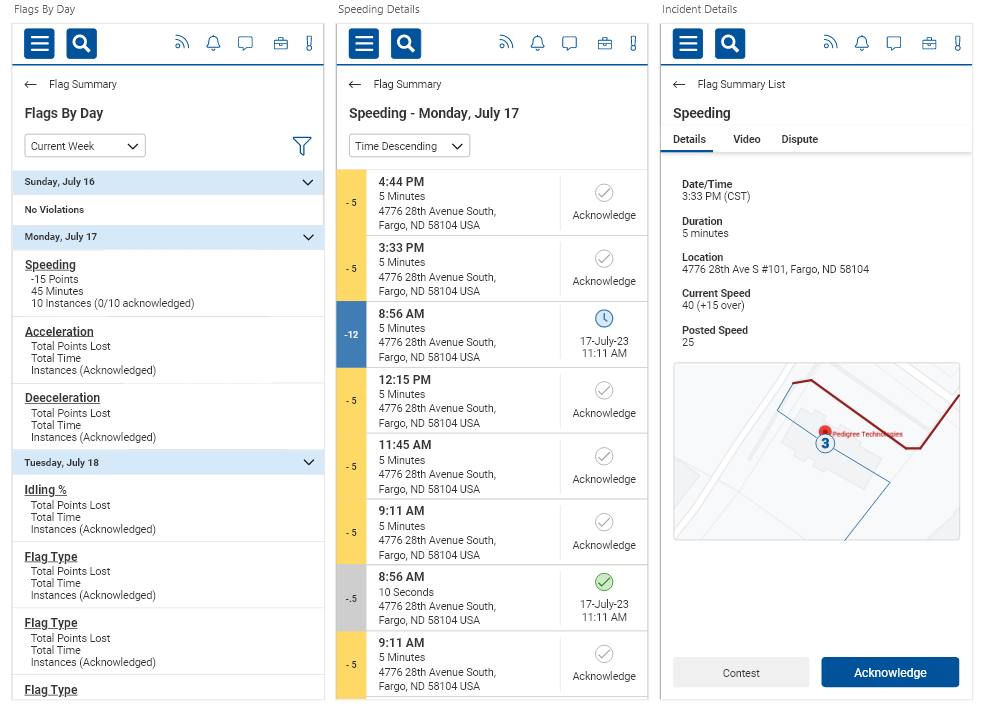
In a full-circle moment, some of the features and user flows I had fleshed out at the beginning of the project would be slated for later work. Asked to create high-fidelity prototypes to give our stakeholders a feel of the experience, here are examples of what will come.
Stat and Event List
The driver can look at and filter a summarized list of a given day. The previous scorecards could only show by a given period, typically a week or month.
Driver Disputes
Drivers will have the capability to dispute an event that they deem incorrect. This includes places that may have changed speed limits that the system has not corrected or long idling percentages when trucks have been stuck in traffic. A manager will later review these instances.
Incident Details
The ability to see specific details of each incident will give drivers and managers better insight into whether each event could have been prevented.
Reflections
Competitive analysis of the driver coaching functionality was crucial in the beginning stages.
Alignment and colors allow quick insight into which stats or assets have acquired the worst infractions.
Alignment and color help with quick assessments but may create more issues with accessibility.
Changes to the existing scorecard feature will allow for a more straightforward implementation of the driver coaching feature.

